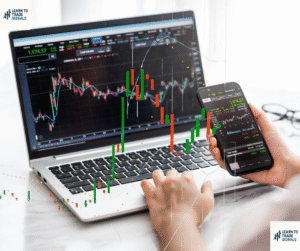
Imagine having a crystal ball that shows you whether traders are feeling greedy or fearful, bullish, or bearish. While no such magic exists, a candlestick charts and candlestick patterns come remarkably close.
For centuries, since their development in 18th-century Japan, candlestick patterns have provided traders with a powerful visual language for understanding market sentiment. They tell a story of the battle between buyers and sellers in a way that simple line charts never could.
In this guide, we’ll demystify how to read a candlestick chart and reveal the 10 most critical candlestick patterns that can help you spot potential trading opportunities.
First, How Do You Read a Single Candlestick?
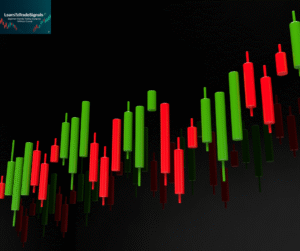
Every candlestick is made up of two main parts: the body and the wick (or shadow).
The Body: The wide part shows the opening and closing prices.
Green/White Body: The closing price was higher than the opening price (Bullish).
Red/Black Body: The closing price was lower than the opening price (Bearish).
The Wicks/Shadows: The thin lines above and below the body represent the highest and lowest prices the asset reached during that period.
The length of the body and wicks tells you the intensity of buying or selling pressure. A long green body shows strong buying, while a long red body shows intense selling.
We’ve split these into Bullish Candlestick Patterns (suggesting a potential price rise) and Bearish Patterns (suggesting a potential price drop). Remember, these patterns are most reliable when they appear at key support or resistance levels.
🟢 Bullish Reversal Candle Stick Patterns
These patterns often signal that a downtrend is exhausting and a reversal upward may be coming.
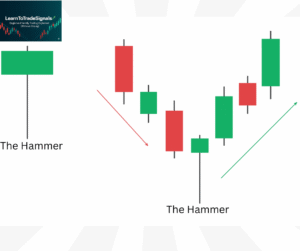
1. The Hammer
- What it looks like: A small body at the top of the trading range with a long lower wick (at least twice the length of the body). It appears during a downtrend.
- The Story: Sellers pushed the price significantly lower, but by the close, buyers aggressively stepped in and drove the price back near the open. This is a strong sign of buyer rejection of lower prices.
- Where to find it: At the bottom of a downtrend.
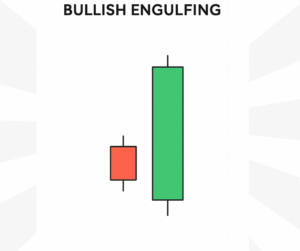
2. The Bullish Engulfing Pattern
- What it looks like: A two-candle pattern. A small red candle is followed by a large green candle that completely “engulfs” the body of the previous red candle.
- The Story: Buyer momentum has completely overwhelmed the prior session’s sellers. This is a powerful shift in control.
- Where to find it: At the end of a downtrend or pullback.
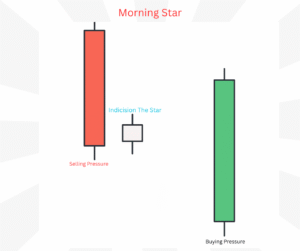
The Morning Star
- What it looks like: A three-candle pattern in a downtrend.
- A long red candle (selling pressure).
- A small-bodied candle (indecision, the “star”).
- A long green candle (buying pressure confirmed).
- The Story: The selling pressure of the first day is followed by indecision, and then buyers take full control on the third day.
- Where to find it: Signaling a potential major bottom after a sustained downtrend.
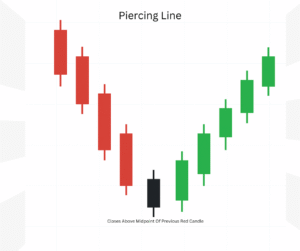
The Piercing Line
- What it looks like: A two-candle pattern. A long red candle is followed by a green candle that opens lower but closes above the midpoint of the red candle’s body.
- The Story: Despite a gap down at the open, buyers fought back fiercely, erasing more than half of the previous day’s losses.
- Where to find it: A strong bullish reversal signal at the end of a downtrend.
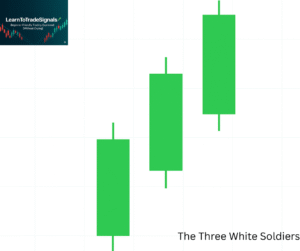
5. The Three White Soldiers
- What it looks like: Three consecutive long green candles with small wicks. Each candle closes higher than the last, near its high.
- The Story: A steamroller of sustained and powerful buying pressure. It indicates a very strong shift to bullish sentiment.
- Where to find it: After a period of consolidation or at the start of a new uptrend.
🔴 Bearish Reversal Patterns
These patterns warn that an uptrend is losing steam and a reversal downward may be imminent.
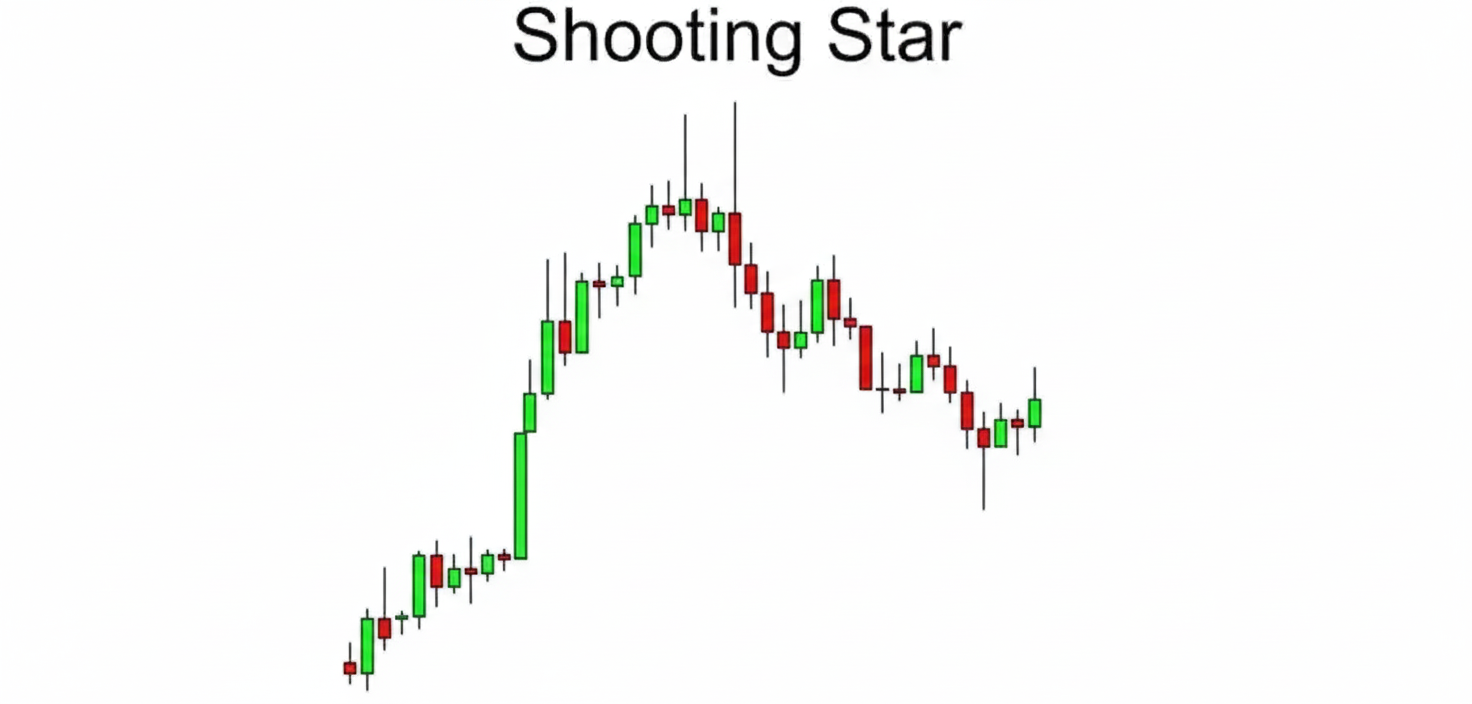
The Shooting Star
- What it looks like: The bearish opposite of the Hammer. A small body at the lower end of the range with a long upper wick. It appears during an uptrend.
- The Story: Buyers pushed the price up during the session, but sellers forcefully rejected those higher prices, driving the asset back down to close near its open.
- Where to find it: At the top of an uptrend.
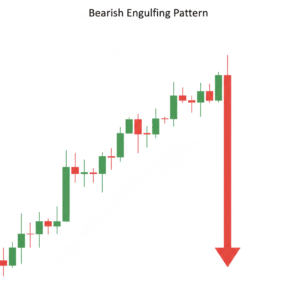
The Bearish Engulfing Pattern
- What it looks like: The mirror image of the Bullish Engulfing. A small green candle is followed by a large red candle that completely “engulfs” the body of the previous green candle.
- The Story: Sellers have stormed the market and decisively taken control from the buyers.
- Where to find it: At the end of an uptrend.
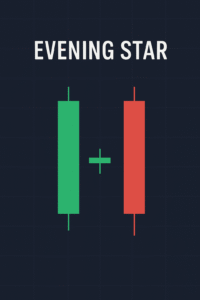
The Evening Star
- What it looks like: The bearish counterpart to the Morning Star.
- A long green candle (buying pressure).
- A small-bodied candle (indecision).
- A long red candle (selling pressure confirmed).
- The Story: Buying momentum stalls and is then overwhelmed by a new wave of sellers.
- Where to find it: Signaling a potential major top after a sustained uptrend.
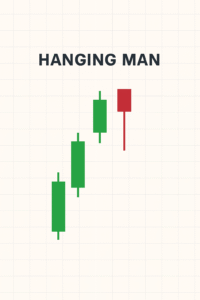
The Hanging Man
- What it looks like: Identical in shape to the Hammer but found in an uptrend.
- The Story: It signals that a significant number of sellers are starting to appear, even if buyers managed to push the price back up by the close. It’s a major warning sign of distribution.
- Where to find it: After a strong uptrend, indicating potential reversal.
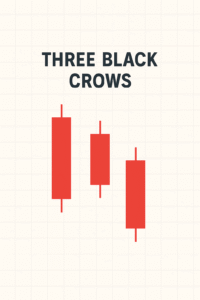
The Three Black Crows
- What it looks like: Three consecutive long red candles with small wicks. Each candle closes lower than the last, near its low.
- The Story: Relentless and aggressive selling pressure. This pattern often marks a decisive shift from a bull to a bear market.
- Where to find it: After a peak, signalling the start of a strong downtrend.
From Knowledge to Profitable Trades: The Critical Next Step
Learning these 10 patterns is a fantastic start. But knowing what a pattern looks like and knowing when to act on it are two very different things. The biggest mistake new traders make is seeing a single pattern in a vacuum and entering a trade without confirmation.
Professional trading requires context. Is the pattern forming at a key support/resistance level? Is there a confluence with other technical indicators like the RSI or Moving Averages? Has the overall market sentiment aligned?
This is where the analysis becomes complex and time-consuming. But there is software that can do the heavy lifting for you.

FAQ: Candlestick Patterns
Q: How reliable are candlestick patterns?
A: No pattern is 100% reliable. Their power increases significantly when they are confirmed by other factors like volume, key support/resistance levels, and broader technical analysis.
Q: What timeframe is best for candlestick patterns?
A: They work on all timeframes! Day traders use them on 1-minute to 1-hour charts, while swing traders use them on 4-hour and daily charts.
Q: Can I use candlestick patterns for Crypto trading?
A: Absolutely. Candlestick patterns are universal and work for Forex, Stocks, Indices, and Cryptocurrencies.
*Disclaimer: Between 74-89% of retail investor accounts lose money when trading CFDs or Spread Betting. You should consider whether you understand how Spread Betting or CFDs work and whether you can afford to take the high risk of losing your money. Trading involves substantial risk and is not suitable for every investor. Past performance is not indicative of future results. This content is for educational purposes only and is not investment advice.