
So, you have opened a trading chart, stared at a sea of red and green bars, and asked yourself, “Is this the Matrix… or a breakdown waiting to happen?”
Don`t worry — we’ve all been there.
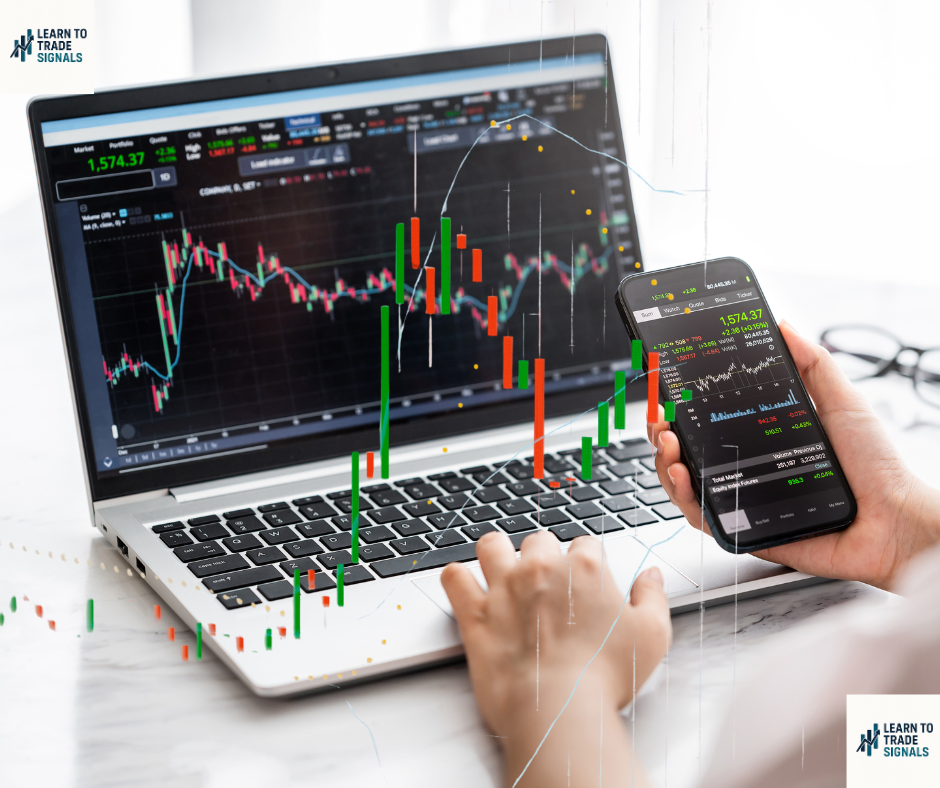
Learning to read a trading chart doesn’t have to feel like decoding ancient hieroglyphs. This guide will walk you through it using plain language, a dash of humour, and simple visuals to make sure your chart-smart without reaching for the tissues.

1. What Even Is a Trading Chart?
A trading chart is like a real-time mood ring for the market. It shows you:
– Price changes over time
– Patterns that suggest where price *might* go
– Points where traders panic, rejoice, or eat snacks while pretending to understand candlesticks
2. Candlesticks – The Building Blocks
Each candlestick shows:
– **Open**: Price when the candle started
– **Close**: Price when the candle ended
– **High & Low**: Tallest and lowest points during that period
**Green Candle = Bullish** (price went up)
**Red Candle = Bearish** (price went down)
Think of them as emotional mood swings — green candles are optimism; red candles are regret with extra seasoning.
3. The Timeframe Trap
Charts can be zoomed in or out using time frames.
– **1-Minute**: Blink-and-you’ll-miss-it chaos
– **1-Hour**: Mid-range clarity
– **1-Day**: Good for trend spotting (and your sanity)
Pro Tip: Beginners should start with the 1-Hour or 1 Day time frames. You will spot trends without overdosing on micro-movements.
4. Support & Resistance – Market’s Brick Walls
– **Support** = A price level where buyers tend to jump in
– **Resistance** = A price where sellers like to take profits
Imagine support and resistance as those annoying invisible walls in video games. Price bounces until someone rage-quits (or breaks out).
5. Patterns That People Worship (and Misuse)
Some common patterns:
– **Double Bottom** = “The market tried to drop twice but changed its mind.” Bullish.
– **Head and Shoulders** = “Market wore a trendy top… then dropped like it’s hot.” Bearish.
– **Triangles** = “Price is getting claustrophobic.” Expect a breakout.
Do not memorize forty-seven patterns. Focus on learning how they help identify momentum.
6. Let VIP Indicators Help You Cheat (Legally)
Why guess when you can use smart tools?
VIP Indicators plug into Trading View and offer:
– Buy/Sell alerts
– Momentum signals
– High win-rate analysis (93% in many cases) They are built for beginners.

7. Your Trading Chart Toolkit
| Tool What It Does
|———————-|———————————-|
Trading View | Charting platform
VIP Indicators | Signal overlay (recommended!)
Moving Averages | Shows overall trend
Volume Indicators | Measures market participation
Final Thoughts
Reading charts does not require a finance degree or a decade of monk-like patience. Start small, zoom out often, and remember — it is okay to Google stuff.
And if you want a shortcut that does not involve crying into your keyboard?
Try VIP Indicators. They are built for beginners who want results, not migraines. Stay tuned for our next post: *“Top 5 Mistakes New Traders Make (And How to Dodge Them Like a Ninja)”
__________________________________________________________________________________________________________________
*Disclaimer: Between 74-89% of retail investor accounts lose money when trading CFDs or Spread Betting. You should consider whether you understand how Spread Betting or CFDs work and whether you can afford to take the high risk of losing your money. Trading involves substantial risk and is not suitable for every investor. Past performance is not indicative of future results. This content is for educational purposes only and is not investment advice.